A Repeatable Workflow for USMLE Biostatistics
Use a repeatable USMLE biostatistics workflow to identify the target quantity, choose the right relationship, estimate, calculate, and review errors.
Biostatistics questions often feel harder than the mathematics warrants. The real difficulty is translation: a stem describes patients, exposures, test results, or outcomes, while the question asks for a compact statistical quantity. If you start calculating before identifying that quantity, even perfect arithmetic can produce the wrong answer.
A repeatable workflow for USMLE biostatistics questions solves this problem by separating interpretation from calculation. First, name what the question wants. Then organize the available data, select the relationship that connects those data to the target, estimate the likely answer, and only then calculate.
This approach fits the USMLE’s single-best-answer format. The official USMLE Step 1 materials provide sample questions and describe single-best-answer questions as the primary Step 1 format. Use those official materials to practice the workflow under an authentic question structure rather than memorizing formulas in isolation.
The seven-step workflow for USMLE biostatistics questions

Use the same sequence every time:
- Read the final question and name the target quantity.
- Extract only the numbers and groups relevant to that target.
- Classify the question into a statistical family.
- Build the smallest useful representation.
- State the relationship in words before choosing a formula.
- Estimate the direction and approximate magnitude.
- Calculate, check units, and select the consistent answer.
The order matters. It prevents a familiar-looking number or formula from controlling your reasoning before you understand the question.
Step 1: Convert the final line into a target noun
Read the final line before working through every detail. Rewrite it mentally as a short target:
- “probability that a positive result is a true positive” becomes **positive predictive value**;
- “reduction in event risk caused by treatment” becomes **absolute risk reduction**;
- “number treated to prevent one additional event” becomes **number needed to treat**;
- “strength of association in a case-control study” becomes **odds ratio**;
- “existing cases at this point in time” becomes **prevalence**.
Do not accept “this is a screening-test question” as your target. That is only a category. Sensitivity, specificity, positive predictive value, and likelihood ratios answer different questions. Name the exact output.
Step 2: Extract data by role, not by presentation order
Once you know the target, label the data according to what each number represents. Depending on the question, useful labels include:
- exposed versus unexposed;
- treatment versus control;
- disease present versus disease absent;
- test positive versus test negative;
- new cases versus all existing cases;
- events versus total people at risk;
- estimate versus standard error.
Ignore numbers that do not participate in the required relationship. Age, follow-up duration, sample size, disease prevalence, and test characteristics may all appear in one stem, but the requested calculation may use only two of them.
Step 3: Assign the question to a statistical family
Classification narrows the possible relationships before you touch a calculator.
| Statistical family | Common target quantities | Recognition cue | |---|---|---| | Disease frequency | Incidence, prevalence | New cases, existing cases, population at risk | | Diagnostic testing | Sensitivity, specificity, predictive values, likelihood ratios | Test result compared with true disease status | | Treatment effects | Absolute risk reduction, relative risk reduction, NNT, NNH | Event rates in treatment and control groups | | Associations | Relative risk, odds ratio, attributable risk | Outcome frequency compared across exposure groups | | Precision and inference | Standard error, confidence interval, statistical significance | Estimate, variability, null value | | Study design and bias | Cohort, case-control, trial, selection bias, information bias | How participants were selected or measured |
Classification is especially important when nearby formulas use the same numbers differently. Relative risk divides two risks; absolute risk reduction subtracts them. Both may be valid calculations, but only one answers the stated question.
Step 4: Build the smallest useful representation
Do not redraw the entire stem. Use the minimum structure needed to protect the denominator.
For diagnostic testing, create a 2 × 2 table with disease status in one direction and test result in the other. For treatment questions, write two event rates. For confidence intervals, mark the estimate, interval, and relevant null value.
A compact scratch-pad setup might look like this:
- Control event rate: 40/200 = 0.20
- Treatment event rate: 20/200 = 0.10
- Target: NNT
That is enough. Extra transcription consumes time and creates more opportunities to swap groups.
Step 5: Say the relationship in words before using symbols
Formulas are safer when attached to meaning. Before writing an equation, complete a verbal statement:
- Sensitivity is the proportion of people **with disease** who test positive.
- Specificity is the proportion of people **without disease** who test negative.
- Positive predictive value is the proportion of **positive tests** that are true positives.
- Relative risk compares event risk in one group with event risk in another.
- Absolute risk reduction is the control event rate minus the treatment event rate.
- NNT is the reciprocal of the absolute risk reduction expressed as a proportion.
Then translate that relationship into notation. This protects you from formula pairs that are easy to reverse, particularly sensitivity versus predictive value and relative versus absolute treatment effects.
Estimate before calculating
Estimation is not optional decoration. It is an error-detection step.
Before performing exact arithmetic, predict three features of the answer:
- **Direction:** Should it be greater than 1, less than 1, positive, or negative?
- **Scale:** Is the likely answer around 0.1, 1, 10, or 100?
- **Units:** Should it be a probability, percentage, ratio, person-time rate, or number of patients?
Suppose 20% of control patients and 10% of treated patients experience an outcome. Before calculating, you should expect:
- a beneficial treatment effect;
- an absolute reduction near 10 percentage points;
- a relative risk near one-half;
- an NNT near 10.
Now calculate:
- Control event rate = 40/200 = 0.20
- Experimental event rate = 20/200 = 0.10
- Absolute risk reduction = 0.20 − 0.10 = 0.10
- NNT = 1/0.10 = 10
If your arithmetic produces an NNT of 0.1 or 100, your estimate tells you to stop and inspect the setup.
Estimation also helps when answer choices are widely separated. You may not need long division if one option is clearly consistent with the expected direction and scale. That is a practical test-taking recommendation, not permission to guess without setting up the relationship.
A compact relationship map worth memorizing
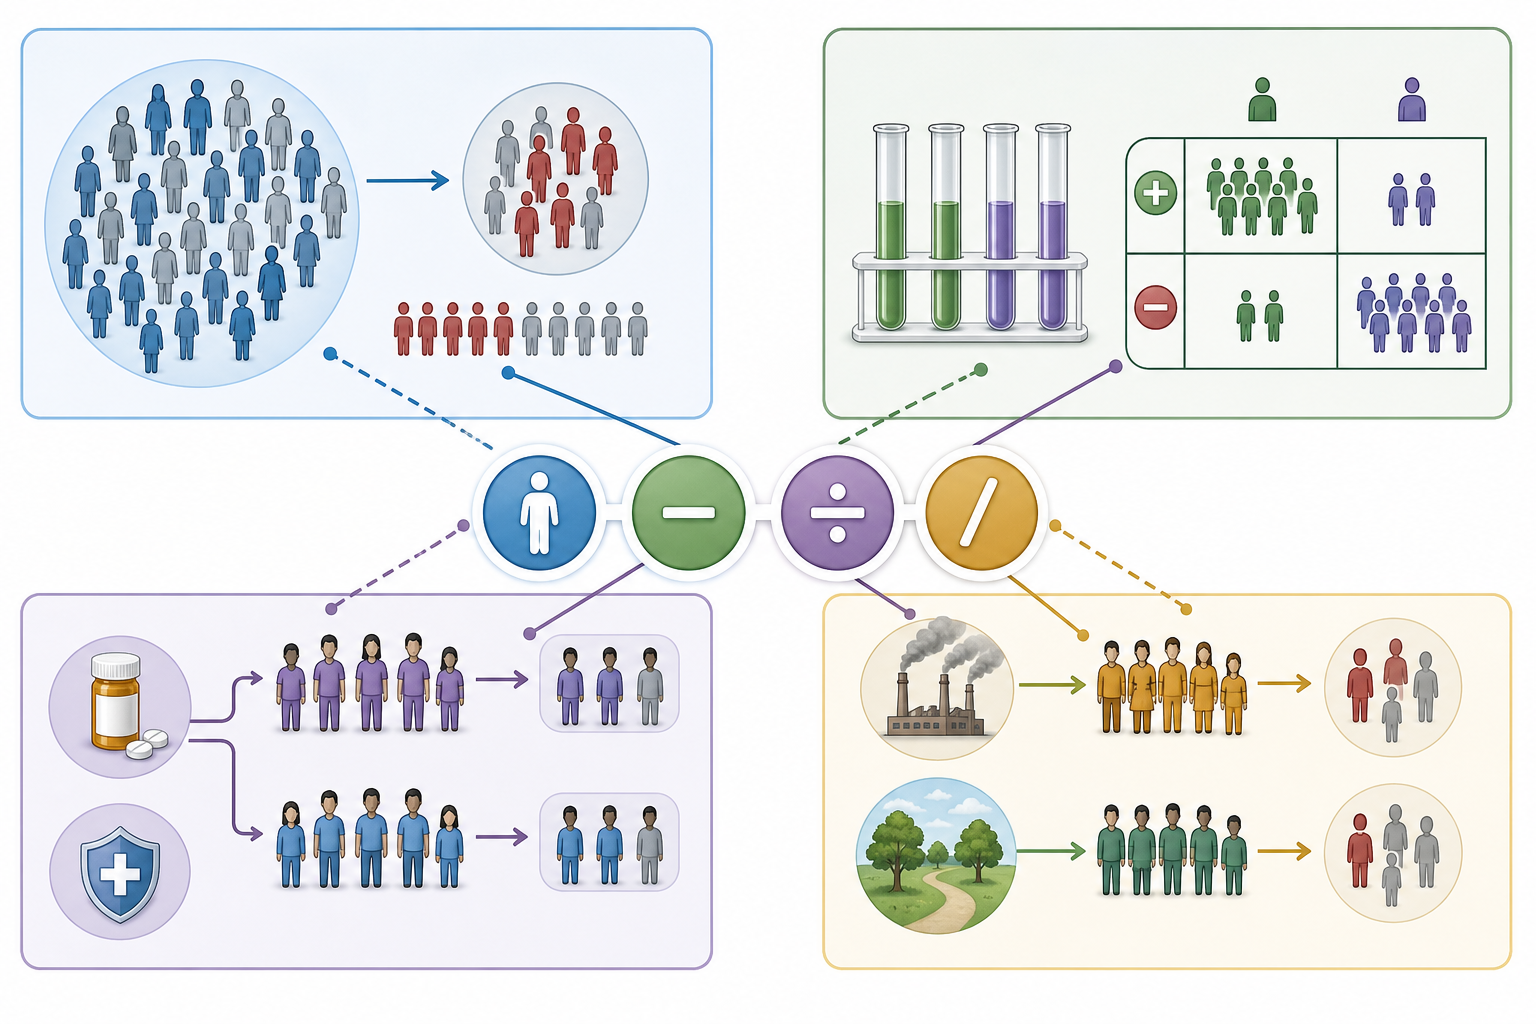
Memorize a small set of connected relationships rather than a disconnected formula sheet.
| Asked quantity | Relationship | Denominator safeguard | |---|---|---| | Incidence proportion | New cases ÷ population initially at risk | Only people capable of becoming new cases | | Prevalence | All existing cases ÷ total population | Includes both old and new cases | | Sensitivity | True positives ÷ all with disease | Condition on disease present | | Specificity | True negatives ÷ all without disease | Condition on disease absent | | Positive predictive value | True positives ÷ all positive tests | Condition on test positive | | Negative predictive value | True negatives ÷ all negative tests | Condition on test negative | | Relative risk | Risk in exposed group ÷ risk in unexposed group | Calculate each group’s risk first | | Odds ratio | ad ÷ bc in a correctly labeled 2 × 2 table | Confirm cell orientation before multiplying | | Absolute risk reduction | Control event rate − treatment event rate | Use proportions, not percentage labels alone | | Relative risk reduction | Absolute risk reduction ÷ control event rate | Divide by baseline control risk | | Number needed to treat | 1 ÷ absolute risk reduction | Enter ARR as a decimal and round up to a whole patient |
The central denominator rule is simple: **ask which population the probability is conditioned on**. “Among people with disease” points to a disease-status denominator. “Among positive test results” points to a test-result denominator.
A realistic 60-second question workflow
Here is how the method can fit inside a timed block.
**First 10 seconds:** Read the final line and name the target. Write “PPV,” “RR,” “NNT,” or another short label.
**Next 15 seconds:** Scan the stem for the groups and numbers required for that target. Label them instead of copying whole sentences.
**Next 10 seconds:** Draw a minimal 2 × 2 table, two event rates, or a confidence-interval line.
**Next 10 seconds:** State the relationship and estimate direction, scale, and units.
**Final 15 seconds:** Calculate and compare the result with your estimate and the answer choices.
Some questions will take longer, particularly those requiring a table reconstructed from prose. Others can be answered faster. The point is not to enforce an exact stopwatch split; it is to preserve the sequence under time pressure.
Review errors by reasoning type, not formula name
A question log becomes useful only when it changes future behavior. Recording “missed NNT” is too vague. Classify the failure by the reasoning step that broke down.
| Error type | What happened | Corrective drill | |---|---|---| | Target error | Calculated relative risk when asked for risk reduction | Rewrite final lines into target nouns without calculating | | Extraction error | Used total sample size instead of the relevant group | Label every number by group and outcome | | Classification error | Treated prevalence as incidence | Sort short vignettes by statistical family | | Representation error | Reversed rows or columns in a 2 × 2 table | Rebuild tables and verify each cell verbally | | Relationship error | Divided when the target required subtraction | State the relationship in words before writing symbols | | Estimation error | Accepted an impossible direction or scale | Predict direction, magnitude, and units for every question | | Arithmetic error | Used 10 instead of 0.10 in the NNT formula | Convert percentages to decimals before calculating | | Interpretation error | Confused statistical significance with clinical importance | Identify the null value and then interpret effect size separately |
For each missed or uncertain question, record four lines:
- **Target:** What quantity was actually requested?
- **My wrong move:** At which reasoning step did I diverge?
- **Correct relationship:** Write it in one sentence.
- **Next-time trigger:** What wording should activate the correct move?
This turns review into pattern recognition. If five errors are all denominator errors, learning five more formulas will not solve the problem. You need repeated denominator drills.
A one-week practice schedule
Use short, deliberate sessions before expecting the workflow to survive full timed blocks.
| Day | Practice focus | Suggested work | Checkpoint | |---|---|---|---| | 1 | Target identification | Classify 20 final question lines without calculating | Name the exact target in at least 16 | | 2 | Denominators and 2 × 2 tables | Reconstruct 10 diagnostic-testing tables | Explain every denominator aloud | | 3 | Risk relationships | Solve 10 RR, ARR, RRR, NNT, or NNH questions | Estimate direction before all calculations | | 4 | Frequency and study design | Mix incidence, prevalence, cohort, and case-control items | Separate design recognition from computation | | 5 | Confidence intervals and interpretation | Review null values and interval meaning | Identify significance without unnecessary arithmetic | | 6 | Timed mixed set | Complete 15–20 biostatistics questions | Use all seven steps while timed | | 7 | Error-directed retest | Redo misses plus matched questions | Correct the reasoning step, not just the answer |
These question counts are practical recommendations, not official USMLE requirements. Adjust them to your study phase, but preserve focused repetition and cumulative review.
Progress checkpoints that show the workflow is working
Do not judge progress only by a single percentage correct. Track process measures over several sessions.
**Checkpoint 1: Target accuracy.** You can name the requested quantity before touching the numbers on at least four of five questions.
**Checkpoint 2: Denominator control.** You can explain verbally why each denominator matches the conditioning phrase in the question.
**Checkpoint 3: Estimation consistency.** Your predicted direction and order of magnitude agree with the final result, even when arithmetic is imperfect.
**Checkpoint 4: Error concentration.** Your review log shows fewer target, setup, and denominator errors. Remaining misses are narrower and easier to drill.
**Checkpoint 5: Timed transfer.** You continue to use the sequence during mixed blocks rather than abandoning it when the stem looks unfamiliar.
Common failure modes and their fixes
**Formula hunting:** You scan memory for an equation as soon as you see numbers. Fix it by refusing to write a formula until you have written the target noun.
**Using every number:** You assume all numerical details must enter the calculation. Fix it by asking what role each number plays in the chosen relationship.
**Skipping the verbal relationship:** You remember symbols but reverse the numerator or groups. Fix it by stating “among whom?” before calculating.
**Calculating without estimating:** You accept a mathematically produced but clinically or statistically implausible option. Fix it by predicting direction, scale, and units.
**Reviewing only the correct formula:** You learn the solution but not why your reasoning failed. Fix it by assigning every miss to a reasoning-error category.
**Practicing only isolated biostatistics sets:** You perform well when the topic is announced but miss it in mixed blocks. Fix it by moving from focused drills to mixed timed questions once the workflow is stable.
Final takeaways
- Translate the final line into an exact target quantity before calculating.
- Organize data by group, outcome, and denominator rather than presentation order.
- State the statistical relationship in words before choosing a formula.
- Estimate direction, magnitude, and units so arithmetic errors become visible.
- Review misses by reasoning type to identify the specific step that needs retraining.
Build your next study block with CoreStepPrep.